The C4 software architecture model
The C4 is a relatively new and simple approach to software architecture diagramming. It is based on the principle of scaling. When we scale up the image, we get higher level of detailing on the diagram.
The model is designed for architects and developers. The top level of the model is also suitable for customer demonstrations.
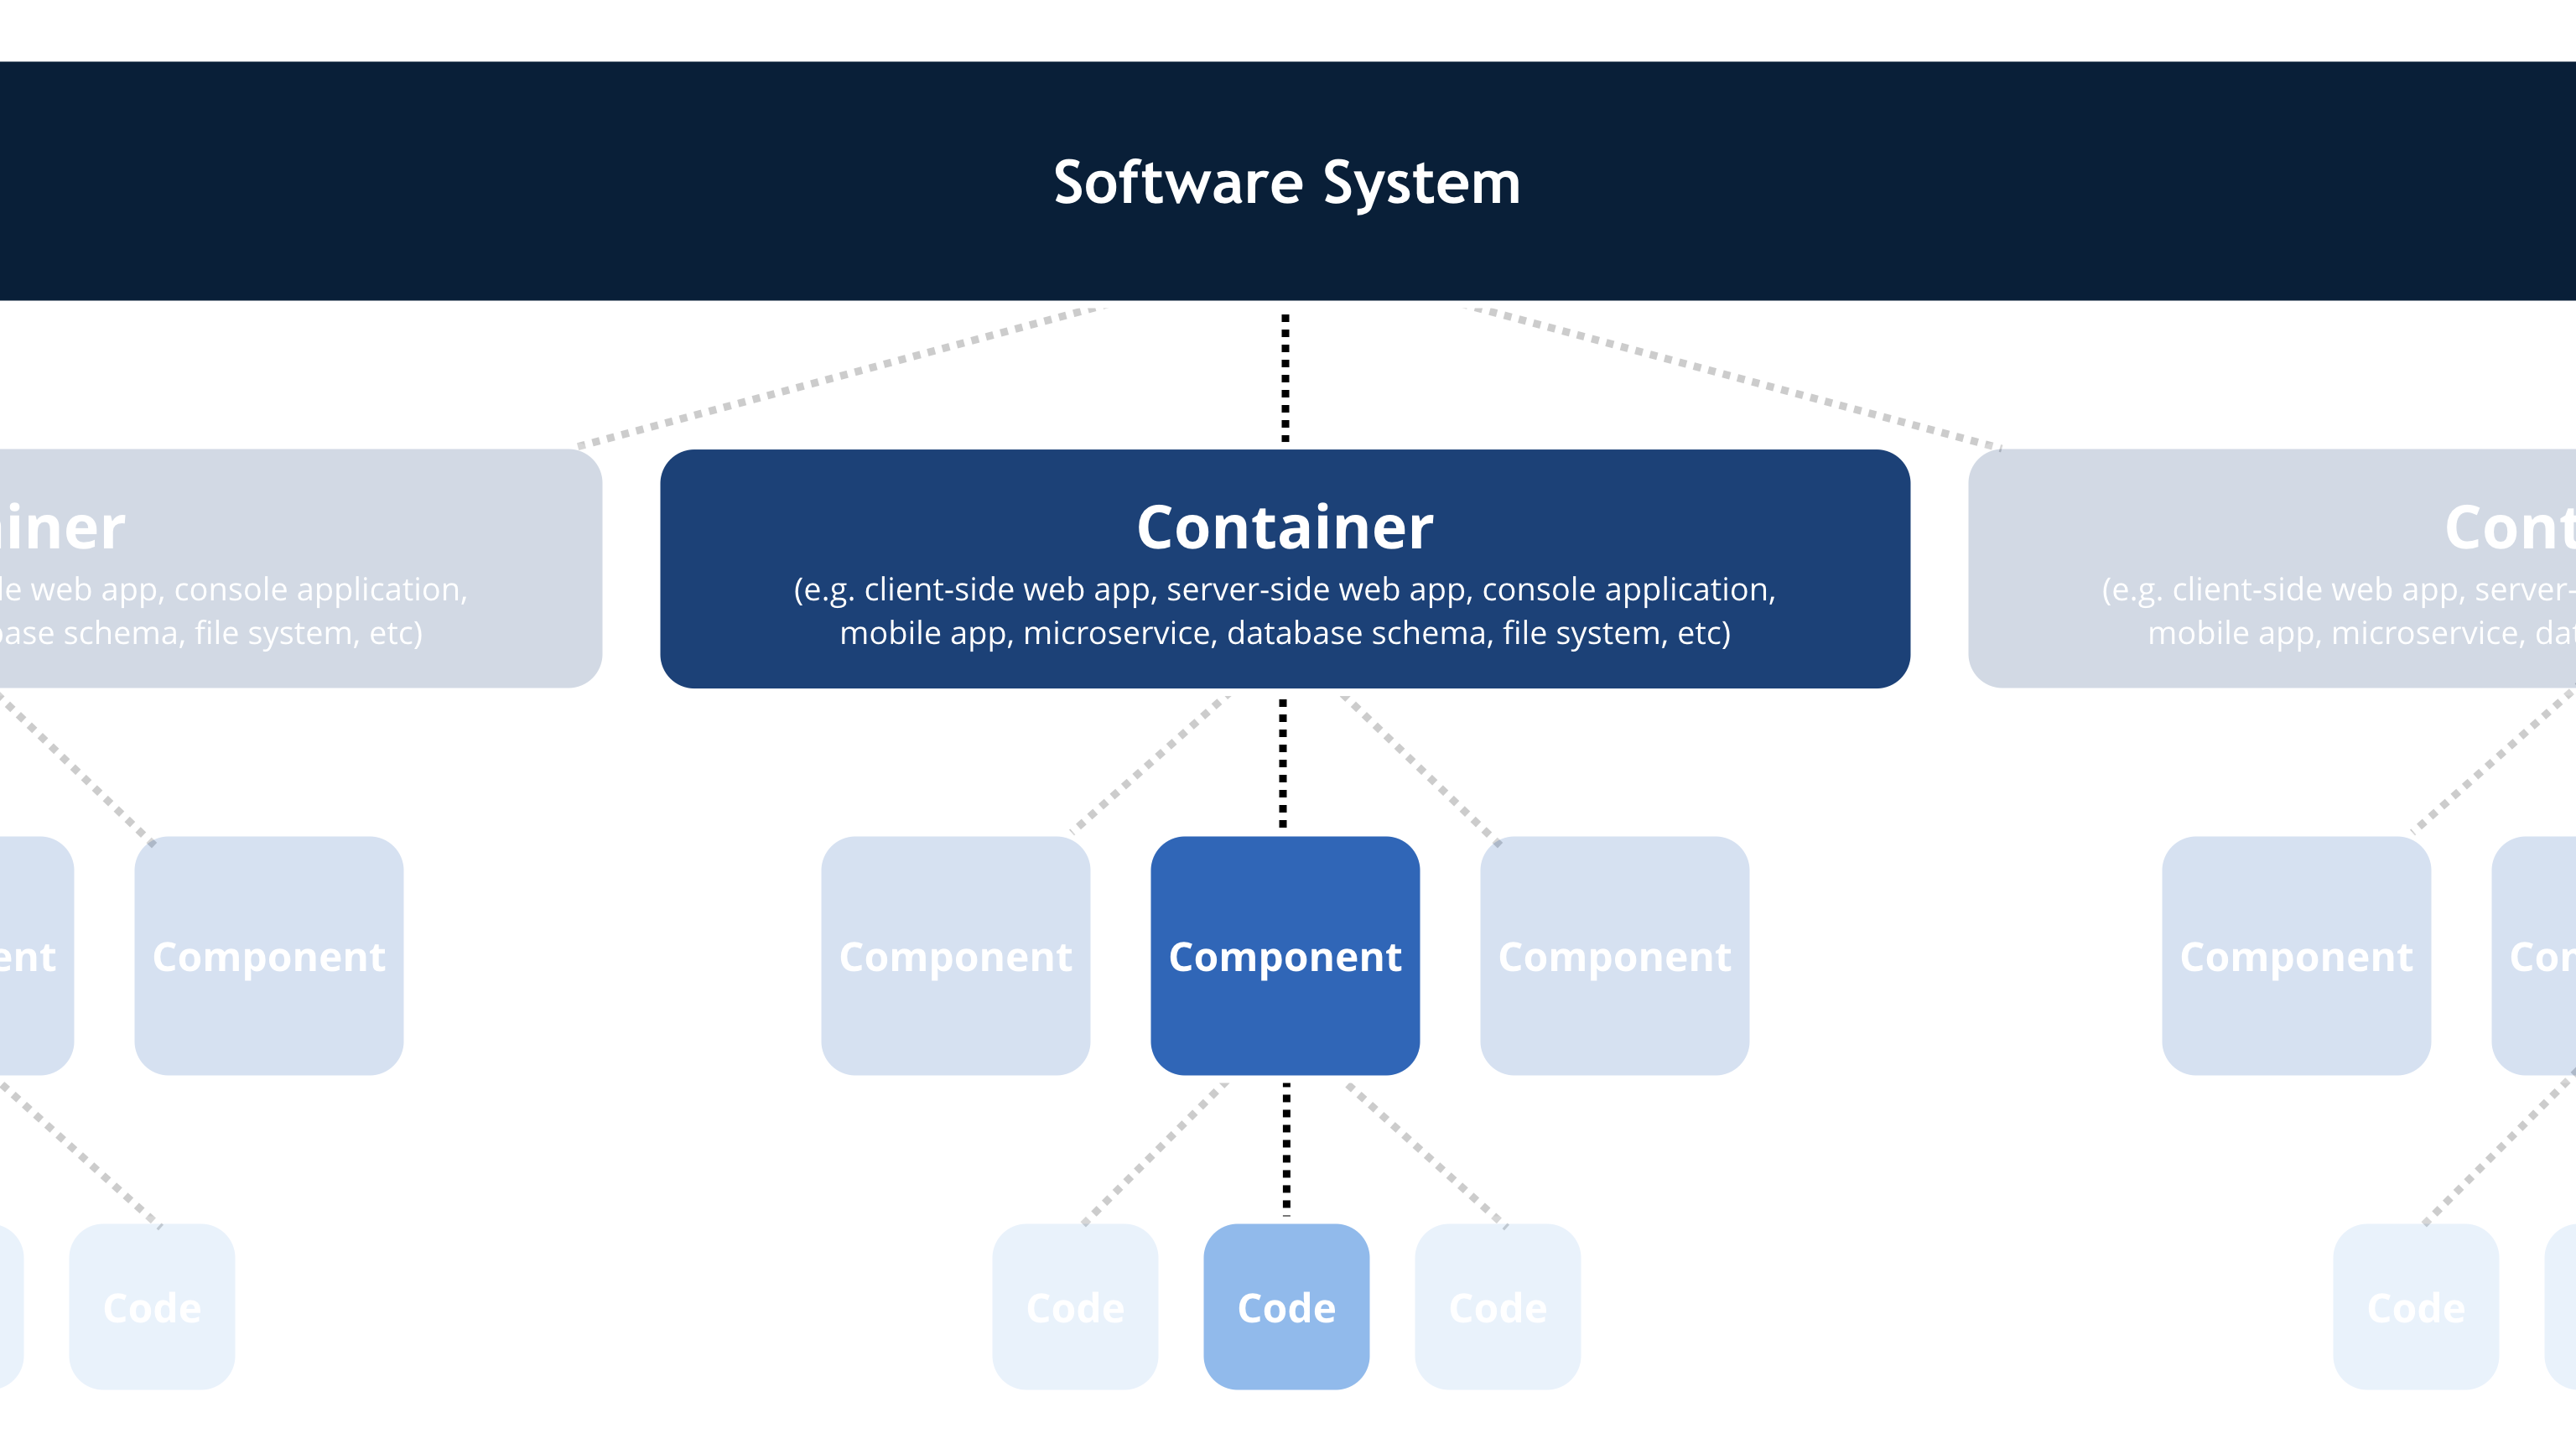
The model describes the system and its context (users and external applications), which is made up of containers (main sub-systems), each of which also contains one or several components, which, in turn, are implemented by one or more code elements.
"The C4 model was created to help software developer teams describe and talk about solution architecture. It can be used both on the early stages of development and to visualize existing solutions. It’s an approach to creating code maps at different levels of detail." (с)Maxim Smirnov.
Same as many other architecture templates, the C4 model was not developed for 1С: Enterprise. In this article, we will try to apply C4 to a top-level description of a software system.
Level 1 - System context
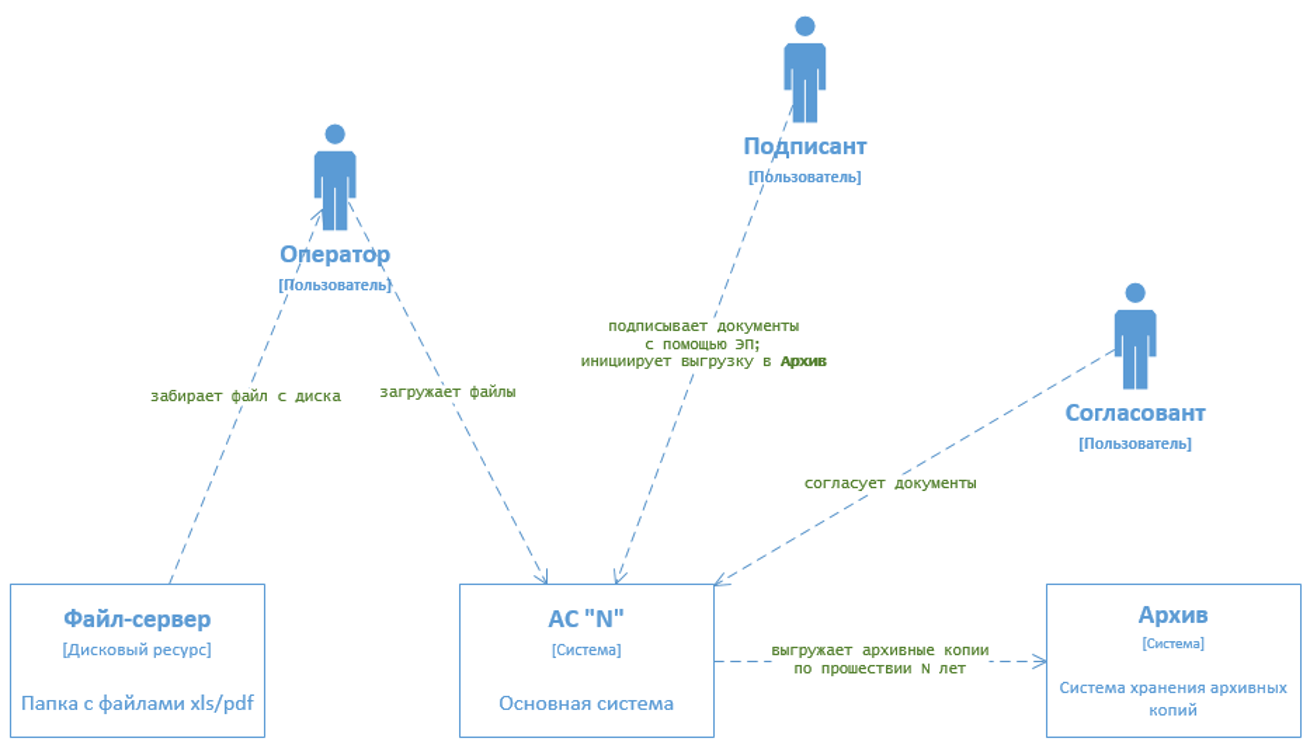
It is the top level, the general overview. It represents a big picture of your system and system users. We draw up a diagram with our system at the core surrounded by users and other systems, with which it interacts.
We summarize all those interactions.
The details are not very important at this stage, it is a scaled down view giving a general idea about the system landscape. The emphasis needs to be placed on people (roles, profiles and etc.) and systems, rather than technologies, protocols and other lower-level details.
This is a diagram you can show your customer to give them an idea about the system
|
System context diagram answers the following questions: 1. What kind of system are we designing? 2. Who are its users? 3. How does it fit into the existing external environment? |
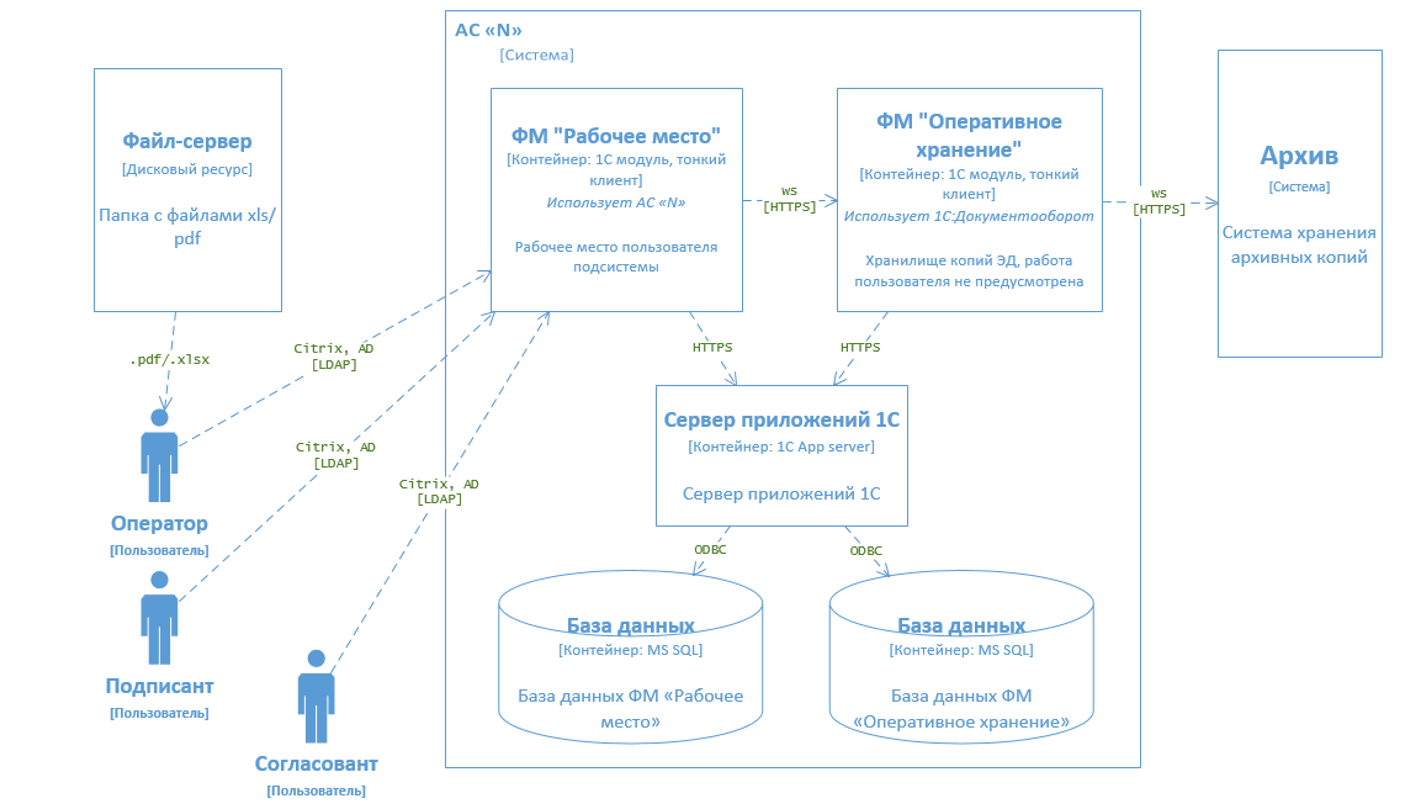
The system from the first diagram is broken down into elements, which are the Containers.
Container is high-level architecture, which describes the functions of each container. It also shows technology choices and how containers interact with each other. It is a simple high-level technology diagram, which can be useful for software developers and tech support teams.
A container is something like a server web application, desktop application, mobile application, database, file system, app server, etc.
For 1C development, I suggest that you represent physical databases and 1C application server as Containers.
On this level, we can also include 1C configuration subsystems or functional modules (by systems we mean primarily the logical level, so strict conformity with specific subsystems of the metadata tree is not a must). Functional modules (blocks), such as “Fixed Assets Subsystem”, “Management Aid Workstation”, “Integration Subsystem”, “Data Security Subsystem”, and etc.
With just one base in place, you can just show the sub-systems.
|
Container diagram answers the following questions: 1. What is the general overview of the software environment? 2. Which high-level technologies are used? 3. What are the functional blocks identified in the system? (if we choose to display them on this level) 4. How do containers interact with each other? |
We scale up and break down every container to describe the main elements and how they interact with each other.
Component diagram shows that Containers are made up of several components, and on this level, we show their purpose and technology/implementation choices.
In case if we didn’t show 1C subsystems and functional models on the Container diagram, they need to be designed on this level.
For Component diagram, we can also show second level components – subcomponents.
For instance:
· Component level – 1C subsystems
· Subcomponents – reference tables, documents and etc. for this subsystem.
With 1C, we can show on this level the table-type objects from 1C metadata – reference tables, documents, registers.
|
Component diagram answers the following questions: 1. What are the components of the system and its functional blocks? 2. Do we understand how the high-level system design is broken down into reference tables, documents and registers? 3. Are all components associated with a specific container? |
The lowest optional level.
In terms of 1C, we can bring here the subcomponents from the previous level.
Besides, here you can describe, for example, web services, important algorithms and so on. But don’t aim to describe everything, just the most important components.
System Landscape diagram
The C4 model provides a static view of a software system but, in the real-world, software systems never live in isolation. For this reason, and particularly if you are responsible for several software systems, it's often useful to understand how all of these software systems fit together within the bounds of an enterprise. To do this, simply add another diagram that sits "on top" of the C4 diagrams, to show the system landscape from an IT perspective. Like the System Context diagram, this diagram can show the organisational boundary, internal/external users and internal/external systems.
Essentially this is a high-level map of the software systems at the enterprise level, with a C4 breakdown for each software system of interest. In practical terms, a system landscape diagram is really just a system context diagram without a specific focus on a particular software system.
|
1. Scope: the entire enterprise 2. Key elements: people and software systems related to the enterprise in scope. 3. Target audience: technical and non-technical people inside and outside the software development team. |
It is a popular diagram based on a UML sequence diagram.
With this diagram, we can not only show integration streams, but also the interaction between data streams (and/or hand-offs) between 1C metadata objects, software modules, and etc.
|
1. Scope: Enterprise, software system, containers and components. 2. Primary and supporting elements: depends on the diagram scope; enterprise (see System Landscape diagram), software system (see System Context or Container diagrams), container (see Component diagram). 3. Target audience: technical and non-technical people inside and outside the software development team. |
A deployment diagram allows you to illustrate how containers in the static model are mapped to infrastructure.
|
1. Scope: software system. 2. . Primary elements: deployment nodes, software system instances and containers instances. 3. Target audience: technical and non-technical people inside and outside the software development team; including software architects, developers, and operations/support staff. |
The C4 model can successfully use UML tools (sequence diagram, deployment diagram, activity diagram). diagram).
Also, С4 can be combined with arc42 template (http://faq.arc42.org/home/)